Data Analysis and Manipulation
Data Analysis and Manipulation#
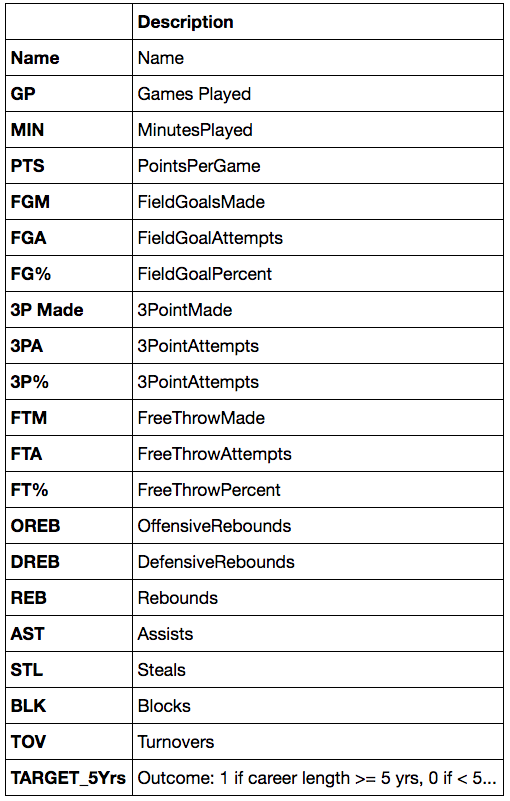
Analyse NBA player data and manipulate it.
import pandas as pd
import matplotlib.pyplot as plt
import seaborn as sns
Import data from CSV
For this dataset, we use the Player Name (first Column) as index
nba_data = pd.read_csv('../input/nba_logreg.csv', index_col=0)
nba_data.rename(columns={'GP': 'GamesPlayed',
'MIN':'MinutesPlayed',
'PTS':'PointsPerGame',
'FGM':'FieldGoalsMade',
'FGA':'FieldGoalAttempts',
'FG%':'FieldGoalPercent',
'3P Made':'3PointMade',
'3PA':'3PointAttempts',
'3P%':'3PointAttemptsPercent',
'FTM':'FreeThrowMade',
'FTA':'FreeThrowAttempts',
'FT%':'FreeThrowPercent',
'OREB':'OffensiveRebounds',
'DREB':'DefensiveRebounds',
'REB':'Rebounds',
'AST':'Assists',
'STL':'Steals',
'BLK':'Blocks',
'TOV':'Turnovers',
'TARGET_5Yrs':'CareerLongerThan5Years'
},inplace=True)
nba_data
| GamesPlayed | MinutesPlayed | PointsPerGame | FieldGoalsMade | FieldGoalAttempts | FieldGoalPercent | 3PointMade | 3PointAttempts | 3PointAttemptsPercent | FreeThrowMade | FreeThrowAttempts | FreeThrowPercent | OffensiveRebounds | DefensiveRebounds | Rebounds | Assists | Steals | Blocks | Turnovers | CareerLongerThan5Years | |
|---|---|---|---|---|---|---|---|---|---|---|---|---|---|---|---|---|---|---|---|---|
| Name | ||||||||||||||||||||
| Brandon Ingram | 36 | 27.4 | 7.4 | 2.6 | 7.6 | 34.7 | 0.5 | 2.1 | 25.0 | 1.6 | 2.3 | 69.9 | 0.7 | 3.4 | 4.1 | 1.9 | 0.4 | 0.4 | 1.3 | 0.0 |
| Andrew Harrison | 35 | 26.9 | 7.2 | 2.0 | 6.7 | 29.6 | 0.7 | 2.8 | 23.5 | 2.6 | 3.4 | 76.5 | 0.5 | 2.0 | 2.4 | 3.7 | 1.1 | 0.5 | 1.6 | 0.0 |
| JaKarr Sampson | 74 | 15.3 | 5.2 | 2.0 | 4.7 | 42.2 | 0.4 | 1.7 | 24.4 | 0.9 | 1.3 | 67.0 | 0.5 | 1.7 | 2.2 | 1.0 | 0.5 | 0.3 | 1.0 | 0.0 |
| Malik Sealy | 58 | 11.6 | 5.7 | 2.3 | 5.5 | 42.6 | 0.1 | 0.5 | 22.6 | 0.9 | 1.3 | 68.9 | 1.0 | 0.9 | 1.9 | 0.8 | 0.6 | 0.1 | 1.0 | 1.0 |
| Matt Geiger | 48 | 11.5 | 4.5 | 1.6 | 3.0 | 52.4 | 0.0 | 0.1 | 0.0 | 1.3 | 1.9 | 67.4 | 1.0 | 1.5 | 2.5 | 0.3 | 0.3 | 0.4 | 0.8 | 1.0 |
| ... | ... | ... | ... | ... | ... | ... | ... | ... | ... | ... | ... | ... | ... | ... | ... | ... | ... | ... | ... | ... |
| Chris Smith | 80 | 15.8 | 4.3 | 1.6 | 3.6 | 43.3 | 0.0 | 0.2 | 14.3 | 1.2 | 1.5 | 79.2 | 0.4 | 0.8 | 1.2 | 2.5 | 0.6 | 0.2 | 0.8 | 0.0 |
| Brent Price | 68 | 12.6 | 3.9 | 1.5 | 4.1 | 35.8 | 0.1 | 0.7 | 16.7 | 0.8 | 1.0 | 79.4 | 0.4 | 1.1 | 1.5 | 2.3 | 0.8 | 0.0 | 1.3 | 1.0 |
| Marlon Maxey | 43 | 12.1 | 5.4 | 2.2 | 3.9 | 55.0 | 0.0 | 0.0 | 0.0 | 1.0 | 1.6 | 64.3 | 1.5 | 2.3 | 3.8 | 0.3 | 0.3 | 0.4 | 0.9 | 0.0 |
| Litterial Green | 52 | 12.0 | 4.5 | 1.7 | 3.8 | 43.9 | 0.0 | 0.2 | 10.0 | 1.2 | 1.8 | 62.5 | 0.2 | 0.4 | 0.7 | 2.2 | 0.4 | 0.1 | 0.8 | 1.0 |
| Jon Barry | 47 | 11.7 | 4.4 | 1.6 | 4.4 | 36.9 | 0.4 | 1.3 | 33.3 | 0.7 | 1.0 | 67.3 | 0.2 | 0.7 | 0.9 | 1.4 | 0.7 | 0.1 | 0.9 | 1.0 |
1340 rows × 20 columns
Now, we should take a look at the data to better understand it.
First, we will display a description of the colums.
Next, we should look at the data.
nba_data.head()
| GamesPlayed | MinutesPlayed | PointsPerGame | FieldGoalsMade | FieldGoalAttempts | FieldGoalPercent | 3PointMade | 3PointAttempts | 3PointAttemptsPercent | FreeThrowMade | FreeThrowAttempts | FreeThrowPercent | OffensiveRebounds | DefensiveRebounds | Rebounds | Assists | Steals | Blocks | Turnovers | CareerLongerThan5Years | |
|---|---|---|---|---|---|---|---|---|---|---|---|---|---|---|---|---|---|---|---|---|
| Name | ||||||||||||||||||||
| Brandon Ingram | 36 | 27.4 | 7.4 | 2.6 | 7.6 | 34.7 | 0.5 | 2.1 | 25.0 | 1.6 | 2.3 | 69.9 | 0.7 | 3.4 | 4.1 | 1.9 | 0.4 | 0.4 | 1.3 | 0.0 |
| Andrew Harrison | 35 | 26.9 | 7.2 | 2.0 | 6.7 | 29.6 | 0.7 | 2.8 | 23.5 | 2.6 | 3.4 | 76.5 | 0.5 | 2.0 | 2.4 | 3.7 | 1.1 | 0.5 | 1.6 | 0.0 |
| JaKarr Sampson | 74 | 15.3 | 5.2 | 2.0 | 4.7 | 42.2 | 0.4 | 1.7 | 24.4 | 0.9 | 1.3 | 67.0 | 0.5 | 1.7 | 2.2 | 1.0 | 0.5 | 0.3 | 1.0 | 0.0 |
| Malik Sealy | 58 | 11.6 | 5.7 | 2.3 | 5.5 | 42.6 | 0.1 | 0.5 | 22.6 | 0.9 | 1.3 | 68.9 | 1.0 | 0.9 | 1.9 | 0.8 | 0.6 | 0.1 | 1.0 | 1.0 |
| Matt Geiger | 48 | 11.5 | 4.5 | 1.6 | 3.0 | 52.4 | 0.0 | 0.1 | 0.0 | 1.3 | 1.9 | 67.4 | 1.0 | 1.5 | 2.5 | 0.3 | 0.3 | 0.4 | 0.8 | 1.0 |
nba_data.sample(5, random_state=13)
| GamesPlayed | MinutesPlayed | PointsPerGame | FieldGoalsMade | FieldGoalAttempts | FieldGoalPercent | 3PointMade | 3PointAttempts | 3PointAttemptsPercent | FreeThrowMade | FreeThrowAttempts | FreeThrowPercent | OffensiveRebounds | DefensiveRebounds | Rebounds | Assists | Steals | Blocks | Turnovers | CareerLongerThan5Years | |
|---|---|---|---|---|---|---|---|---|---|---|---|---|---|---|---|---|---|---|---|---|
| Name | ||||||||||||||||||||
| Tyler Johnson | 32 | 18.8 | 5.9 | 2.2 | 5.2 | 41.9 | 0.6 | 1.5 | 37.5 | 1.0 | 1.5 | 68.1 | 0.4 | 2.1 | 2.5 | 1.3 | 1.0 | 0.3 | 0.9 | 0.0 |
| Eric Washington | 66 | 23.3 | 7.7 | 3.0 | 7.5 | 40.4 | 0.7 | 2.1 | 32.1 | 1.0 | 1.3 | 78.3 | 0.7 | 1.2 | 1.9 | 1.2 | 0.8 | 0.4 | 1.1 | 0.0 |
| Sam Williams | 59 | 18.2 | 6.1 | 2.6 | 4.7 | 55.6 | 0.0 | 0.0 | NaN | 0.8 | 1.5 | 55.1 | 1.5 | 3.7 | 5.2 | 0.6 | 0.8 | 1.3 | 1.1 | 0.0 |
| John Williams | 78 | 22.7 | 9.2 | 3.6 | 8.0 | 45.4 | 0.1 | 0.5 | 22.2 | 1.8 | 2.9 | 64.6 | 1.7 | 3.0 | 4.7 | 2.4 | 1.6 | 0.4 | 1.6 | 1.0 |
| Jim Brogan | 63 | 16.3 | 6.3 | 2.6 | 5.8 | 45.3 | 0.1 | 0.5 | 28.1 | 1.0 | 1.3 | 72.6 | 1.0 | 0.9 | 1.9 | 2.5 | 0.8 | 0.2 | 1.3 | 0.0 |
nba_data.info()
<class 'pandas.core.frame.DataFrame'>
Index: 1340 entries, Brandon Ingram to Jon Barry
Data columns (total 20 columns):
 #   Column                  Non-Null Count  Dtype
---  ------                  --------------  -----
 0   GamesPlayed             1340 non-null   int64
 1   MinutesPlayed           1340 non-null   float64
 2   PointsPerGame           1340 non-null   float64
 3   FieldGoalsMade          1340 non-null   float64
 4   FieldGoalAttempts       1340 non-null   float64
 5   FieldGoalPercent        1340 non-null   float64
 6   3PointMade              1340 non-null   float64
 7   3PointAttempts          1340 non-null   float64
 8   3PointAttemptsPercent   1329 non-null   float64
 9   FreeThrowMade           1340 non-null   float64
 10  FreeThrowAttempts       1340 non-null   float64
 11  FreeThrowPercent        1340 non-null   float64
 12  OffensiveRebounds       1340 non-null   float64
 13  DefensiveRebounds       1340 non-null   float64
 14  Rebounds                1340 non-null   float64
 15  Assists                 1340 non-null   float64
 16  Steals                  1340 non-null   float64
 17  Blocks                  1340 non-null   float64
 18  Turnovers               1340 non-null   float64
 19  CareerLongerThan5Years  1340 non-null   float64
dtypes: float64(19), int64(1)
memory usage: 219.8+ KB
By taking a look at the info, we can see that the 3PointAttemptsPercent column has 11 null values. Those
nba_data.describe()
| GamesPlayed | MinutesPlayed | PointsPerGame | FieldGoalsMade | FieldGoalAttempts | FieldGoalPercent | 3PointMade | 3PointAttempts | 3PointAttemptsPercent | FreeThrowMade | FreeThrowAttempts | FreeThrowPercent | OffensiveRebounds | DefensiveRebounds | Rebounds | Assists | Steals | Blocks | Turnovers | CareerLongerThan5Years | |
|---|---|---|---|---|---|---|---|---|---|---|---|---|---|---|---|---|---|---|---|---|
| count | 1340.000000 | 1340.000000 | 1340.000000 | 1340.000000 | 1340.000000 | 1340.000000 | 1340.000000 | 1340.000000 | 1329.000000 | 1340.000000 | 1340.000000 | 1340.000000 | 1340.000000 | 1340.000000 | 1340.000000 | 1340.000000 | 1340.000000 | 1340.000000 | 1340.000000 | 1340.000000 |
| mean | 60.414179 | 17.624627 | 6.801493 | 2.629104 | 5.885299 | 44.169403 | 0.247612 | 0.779179 | 19.308126 | 1.297687 | 1.821940 | 70.300299 | 1.009403 | 2.025746 | 3.034478 | 1.550522 | 0.618507 | 0.368582 | 1.193582 | 0.620149 |
| std | 17.433992 | 8.307964 | 4.357545 | 1.683555 | 3.593488 | 6.137679 | 0.383688 | 1.061847 | 16.022916 | 0.987246 | 1.322984 | 10.578479 | 0.777119 | 1.360008 | 2.057774 | 1.471169 | 0.409759 | 0.429049 | 0.722541 | 0.485531 |
| min | 11.000000 | 3.100000 | 0.700000 | 0.300000 | 0.800000 | 23.800000 | 0.000000 | 0.000000 | 0.000000 | 0.000000 | 0.000000 | 0.000000 | 0.000000 | 0.200000 | 0.300000 | 0.000000 | 0.000000 | 0.000000 | 0.100000 | 0.000000 |
| 25% | 47.000000 | 10.875000 | 3.700000 | 1.400000 | 3.300000 | 40.200000 | 0.000000 | 0.000000 | 0.000000 | 0.600000 | 0.900000 | 64.700000 | 0.400000 | 1.000000 | 1.500000 | 0.600000 | 0.300000 | 0.100000 | 0.700000 | 0.000000 |
| 50% | 63.000000 | 16.100000 | 5.550000 | 2.100000 | 4.800000 | 44.100000 | 0.100000 | 0.300000 | 22.400000 | 1.000000 | 1.500000 | 71.250000 | 0.800000 | 1.700000 | 2.500000 | 1.100000 | 0.500000 | 0.200000 | 1.000000 | 1.000000 |
| 75% | 77.000000 | 22.900000 | 8.800000 | 3.400000 | 7.500000 | 47.900000 | 0.400000 | 1.200000 | 32.500000 | 1.600000 | 2.300000 | 77.600000 | 1.400000 | 2.600000 | 4.000000 | 2.000000 | 0.800000 | 0.500000 | 1.500000 | 1.000000 |
| max | 82.000000 | 40.900000 | 28.200000 | 10.200000 | 19.800000 | 73.700000 | 2.300000 | 6.500000 | 100.000000 | 7.700000 | 10.200000 | 100.000000 | 5.300000 | 9.600000 | 13.900000 | 10.600000 | 2.500000 | 3.900000 | 4.400000 | 1.000000 |
nba_data.dtypes
GamesPlayed                 int64
MinutesPlayed             float64
PointsPerGame             float64
FieldGoalsMade            float64
FieldGoalAttempts         float64
FieldGoalPercent          float64
3PointMade                float64
3PointAttempts            float64
3PointAttemptsPercent     float64
FreeThrowMade             float64
FreeThrowAttempts         float64
FreeThrowPercent          float64
OffensiveRebounds         float64
DefensiveRebounds         float64
Rebounds                  float64
Assists                   float64
Steals                    float64
Blocks                    float64
Turnovers                 float64
CareerLongerThan5Years    float64
dtype: object
nba_data.isnull().sum()
GamesPlayed                0
MinutesPlayed              0
PointsPerGame              0
FieldGoalsMade             0
FieldGoalAttempts          0
FieldGoalPercent           0
3PointMade                 0
3PointAttempts             0
3PointAttemptsPercent     11
FreeThrowMade              0
FreeThrowAttempts          0
FreeThrowPercent           0
OffensiveRebounds          0
DefensiveRebounds          0
Rebounds                   0
Assists                    0
Steals                     0
Blocks                     0
Turnovers                  0
CareerLongerThan5Years     0
dtype: int64
It looks like there are 11 rows which have null 3PointAttemtsPercent
nba_data.loc[nba_data["3PointAttemptsPercent"].isnull()]
| GamesPlayed | MinutesPlayed | PointsPerGame | FieldGoalsMade | FieldGoalAttempts | FieldGoalPercent | 3PointMade | 3PointAttempts | 3PointAttemptsPercent | FreeThrowMade | FreeThrowAttempts | FreeThrowPercent | OffensiveRebounds | DefensiveRebounds | Rebounds | Assists | Steals | Blocks | Turnovers | CareerLongerThan5Years | |
|---|---|---|---|---|---|---|---|---|---|---|---|---|---|---|---|---|---|---|---|---|
| Name | ||||||||||||||||||||
| Ken Johnson | 64 | 12.7 | 4.1 | 1.8 | 3.3 | 52.8 | 0.0 | 0.0 | NaN | 0.6 | 1.3 | 43.5 | 1.4 | 2.4 | 3.8 | 0.3 | 0.2 | 0.3 | 0.9 | 0.0 |
| Ken Johnson | 64 | 12.7 | 4.1 | 1.8 | 3.3 | 52.8 | 0.0 | 0.0 | NaN | 0.6 | 1.3 | 43.5 | 1.4 | 2.4 | 3.8 | 0.3 | 0.2 | 0.3 | 0.9 | 0.0 |
| Pete Williams | 53 | 10.8 | 2.8 | 1.3 | 2.1 | 60.4 | 0.0 | 0.0 | NaN | 0.3 | 0.8 | 42.5 | 0.9 | 1.9 | 2.8 | 0.3 | 0.4 | 0.4 | 0.4 | 0.0 |
| Melvin Turpin | 79 | 24.7 | 10.6 | 4.6 | 9.0 | 51.1 | 0.0 | 0.0 | NaN | 1.4 | 1.8 | 78.4 | 2.0 | 3.8 | 5.7 | 0.5 | 0.5 | 1.1 | 1.5 | 1.0 |
| Jim Petersen | 60 | 11.9 | 3.2 | 1.2 | 2.4 | 48.6 | 0.0 | 0.0 | NaN | 0.8 | 1.1 | 75.8 | 0.7 | 1.7 | 2.5 | 0.5 | 0.2 | 0.5 | 1.2 | 1.0 |
| Tom Scheffler | 39 | 6.9 | 1.3 | 0.5 | 1.3 | 41.2 | 0.0 | 0.0 | NaN | 0.3 | 0.5 | 50.0 | 0.5 | 1.5 | 1.9 | 0.3 | 0.2 | 0.3 | 0.4 | 0.0 |
| Sam Williams | 59 | 18.2 | 6.1 | 2.6 | 4.7 | 55.6 | 0.0 | 0.0 | NaN | 0.8 | 1.5 | 55.1 | 1.5 | 3.7 | 5.2 | 0.6 | 0.8 | 1.3 | 1.1 | 0.0 |
| Kurt Nimphius | 63 | 17.2 | 5.3 | 2.2 | 4.7 | 46.1 | 0.0 | 0.0 | NaN | 1.0 | 1.7 | 58.3 | 1.5 | 3.2 | 4.7 | 1.0 | 0.3 | 1.3 | 0.9 | 1.0 |
| Pete Verhoeven | 71 | 17.0 | 4.9 | 2.1 | 4.2 | 50.3 | 0.0 | 0.0 | NaN | 0.7 | 1.0 | 70.8 | 1.5 | 2.1 | 3.6 | 0.7 | 0.6 | 0.3 | 0.8 | 1.0 |
| Jim Smith | 72 | 11.9 | 2.9 | 1.2 | 2.3 | 50.9 | 0.0 | 0.0 | NaN | 0.5 | 1.2 | 45.9 | 1.0 | 1.5 | 2.5 | 0.6 | 0.3 | 0.7 | 0.7 | 0.0 |
| Jeff Wilkins | 56 | 18.9 | 4.7 | 2.1 | 4.6 | 45.0 | 0.0 | 0.0 | NaN | 0.5 | 0.7 | 67.5 | 1.1 | 3.8 | 4.9 | 0.7 | 0.6 | 0.8 | 1.1 | 1.0 |
print("Rows with null 3PointAttemptsPercent: " + str(len(nba_data.loc[nba_data["3PointAttemptsPercent"].isnull()])))

print("Rows with null 3PointAttemptsPercent and a 3PointAttempts > 0: " + str(len(nba_data.loc[nba_data["3PointAttemptsPercent"].isnull() & nba_data["3PointAttempts"] > 0])))
Rows with null 3PointAttemptsPercent: 11
Rows with null 3PointAttemptsPercent and a 3PointAttempts > 0: 0
Due to 3PointsAttemptsPercent being null only when the 3PointAttempts are 0, 3PointsAttemptPercent can be set to 0 where it is nan.
nba_data["3PointAttemptsPercent"].fillna(0, inplace=True)
nba_data.info()
<class 'pandas.core.frame.DataFrame'>
Index: 1340 entries, Brandon Ingram to Jon Barry
Data columns (total 20 columns):
 #   Column                  Non-Null Count  Dtype
---  ------                  --------------  -----
 0   GamesPlayed             1340 non-null   int64
 1   MinutesPlayed           1340 non-null   float64
 2   PointsPerGame           1340 non-null   float64
 3   FieldGoalsMade          1340 non-null   float64
 4   FieldGoalAttempts       1340 non-null   float64
 5   FieldGoalPercent        1340 non-null   float64
 6   3PointMade              1340 non-null   float64
 7   3PointAttempts          1340 non-null   float64
 8   3PointAttemptsPercent   1340 non-null   float64
 9   FreeThrowMade           1340 non-null   float64
 10  FreeThrowAttempts       1340 non-null   float64
 11  FreeThrowPercent        1340 non-null   float64
 12  OffensiveRebounds       1340 non-null   float64
 13  DefensiveRebounds       1340 non-null   float64
 14  Rebounds                1340 non-null   float64
 15  Assists                 1340 non-null   float64
 16  Steals                  1340 non-null   float64
 17  Blocks                  1340 non-null   float64
 18  Turnovers               1340 non-null   float64
 19  CareerLongerThan5Years  1340 non-null   float64
dtypes: float64(19), int64(1)
memory usage: 219.8+ KB
nba_data["CareerLongerThan5Years"].value_counts()
1.0    831
0.0    509
Name: CareerLongerThan5Years, dtype: int64
A lot more players have a career longer than 5 years (about 300 more).
nba_data.iloc[:,:5].join(nba_data.iloc[:,-1:]).groupby('CareerLongerThan5Years').agg(['min', 'mean', 'max'])
| GamesPlayed | MinutesPlayed | PointsPerGame | FieldGoalsMade | FieldGoalAttempts | |||||||||||
|---|---|---|---|---|---|---|---|---|---|---|---|---|---|---|---|
| min | mean | max | min | mean | max | min | mean | max | min | mean | max | min | mean | max | |
| CareerLongerThan5Years | |||||||||||||||
| 0.0 | 11 | 52.645270 | 82 | 3.1 | 14.617061 | 37.2 | 0.7 | 5.258953 | 21.9 | 0.3 | 2.021959 | 8.0 | 0.8 | 4.672804 | 17.6 |
| 1.0 | 16 | 64.932548 | 82 | 4.4 | 19.353747 | 40.9 | 1.0 | 7.777623 | 28.2 | 0.4 | 3.003961 | 10.2 | 0.8 | 6.609315 | 19.8 |
nba_data.iloc[:,5:10].join(nba_data.iloc[:,-1:]).groupby('CareerLongerThan5Years').agg(['min', 'mean', 'max'])
| FieldGoalPercent | 3PointMade | 3PointAttempts | 3PointAttemptsPercent | FreeThrowMade | |||||||||||
|---|---|---|---|---|---|---|---|---|---|---|---|---|---|---|---|
| min | mean | max | min | mean | max | min | mean | max | min | mean | max | min | mean | max | |
| CareerLongerThan5Years | |||||||||||||||
| 0.0 | 23.8 | 42.602196 | 65.9 | 0.0 | 0.222635 | 1.6 | 0.0 | 0.738851 | 4.8 | 0.0 | 18.394088 | 100.0 | 0.0 | 0.992905 | 5.0 |
| 1.0 | 29.2 | 45.131585 | 73.7 | 0.0 | 0.247002 | 2.3 | 0.0 | 0.769058 | 6.5 | 0.0 | 18.557602 | 100.0 | 0.1 | 1.521949 | 7.7 |
nba_data.iloc[:,10:15].join(nba_data.iloc[:,-1:]).groupby('CareerLongerThan5Years').agg(['min', 'mean', 'max'])
| FreeThrowAttempts | FreeThrowPercent | OffensiveRebounds | DefensiveRebounds | Rebounds | |||||||||||
|---|---|---|---|---|---|---|---|---|---|---|---|---|---|---|---|
| min | mean | max | min | mean | max | min | mean | max | min | mean | max | min | mean | max | |
| CareerLongerThan5Years | |||||||||||||||
| 0.0 | 0.0 | 1.427027 | 6.2 | 0.0 | 68.449155 | 100.0 | 0.0 | 0.754392 | 3.9 | 0.2 | 1.585304 | 7.7 | 0.3 | 2.338851 | 11.0 |
| 1.0 | 0.1 | 2.126874 | 10.2 | 28.6 | 70.717666 | 100.0 | 0.1 | 1.173662 | 5.3 | 0.3 | 2.289615 | 9.6 | 0.4 | 3.465203 | 13.9 |
nba_data.iloc[:,15:].groupby('CareerLongerThan5Years').agg(['min', 'mean', 'max'])
| Assists | Steals | Blocks | Turnovers | |||||||||
|---|---|---|---|---|---|---|---|---|---|---|---|---|
| min | mean | max | min | mean | max | min | mean | max | min | mean | max | |
| CareerLongerThan5Years | ||||||||||||
| 0.0 | 0.0 | 1.221022 | 8.7 | 0.0 | 0.498232 | 2.1 | 0.0 | 0.253438 | 2.1 | 0.1 | 0.942240 | 3.9 |
| 1.0 | 0.0 | 1.752347 | 10.6 | 0.0 | 0.692178 | 2.5 | 0.0 | 0.439110 | 3.9 | 0.1 | 1.347533 | 4.4 |
The average player who has a career longer than 5 years plays aprox. 10 games more than a player whose career doesnt last that long.
He also plays on average more minutes per game.
Surprisingly, the difference between the avg. Three Points made aren’t that big, allthough the players with longer careers succeed more in free throws and are better at defence.
They also have on average a higher amount of points made per game.
corr = nba_data.corr()[['CareerLongerThan5Years']].sort_values("CareerLongerThan5Years", ascending=False, key=lambda col: abs(col))
corr.iloc[1:] # Ignore CareerLongerThan5Years row
| CareerLongerThan5Years | |
|---|---|
| GamesPlayed | 0.396833 |
| MinutesPlayed | 0.317805 |
| FieldGoalsMade | 0.317594 |
| PointsPerGame | 0.315981 |
| Rebounds | 0.299406 |
| FreeThrowMade | 0.296841 |
| FreeThrowAttempts | 0.296089 |
| OffensiveRebounds | 0.293307 |
| FieldGoalAttempts | 0.292660 |
| DefensiveRebounds | 0.284677 |
| Turnovers | 0.272348 |
| Steals | 0.229811 |
| FieldGoalPercent | 0.227134 |
| Blocks | 0.210114 |
| Assists | 0.175353 |
| FreeThrowPercent | 0.106706 |
| 3PointMade | 0.036619 |
| 3PointAttempts | 0.018110 |
| 3PointAttemptsPercent | -0.000004 |
By taking a look at the correlation matrix, the 4 most decisive columns for the prediction are GamesPlayed,MinutesPlayed, FieldGoalsMade and PointsPerGame.
nba_data.to_csv('../output/new_nba_data.csv')