Data Visualisation
Data Visualisation#
Visualize NBA player data to find out which features can be used for classification.
import pandas as pd
import matplotlib.pyplot as plt
import seaborn as sns
import math
nba_data = pd.read_csv('../output/new_nba_data.csv', index_col=0)
nba_data
| GamesPlayed | MinutesPlayed | PointsPerGame | FieldGoalsMade | FieldGoalAttempts | FieldGoalPercent | 3PointMade | 3PointAttempts | 3PointAttemptsPercent | FreeThrowMade | FreeThrowAttempts | FreeThrowPercent | OffensiveRebounds | DefensiveRebounds | Rebounds | Assists | Steals | Blocks | Turnovers | CareerLongerThan5Years | |
|---|---|---|---|---|---|---|---|---|---|---|---|---|---|---|---|---|---|---|---|---|
| Name | ||||||||||||||||||||
| Brandon Ingram | 36 | 27.4 | 7.4 | 2.6 | 7.6 | 34.7 | 0.5 | 2.1 | 25.0 | 1.6 | 2.3 | 69.9 | 0.7 | 3.4 | 4.1 | 1.9 | 0.4 | 0.4 | 1.3 | 0.0 |
| Andrew Harrison | 35 | 26.9 | 7.2 | 2.0 | 6.7 | 29.6 | 0.7 | 2.8 | 23.5 | 2.6 | 3.4 | 76.5 | 0.5 | 2.0 | 2.4 | 3.7 | 1.1 | 0.5 | 1.6 | 0.0 |
| JaKarr Sampson | 74 | 15.3 | 5.2 | 2.0 | 4.7 | 42.2 | 0.4 | 1.7 | 24.4 | 0.9 | 1.3 | 67.0 | 0.5 | 1.7 | 2.2 | 1.0 | 0.5 | 0.3 | 1.0 | 0.0 |
| Malik Sealy | 58 | 11.6 | 5.7 | 2.3 | 5.5 | 42.6 | 0.1 | 0.5 | 22.6 | 0.9 | 1.3 | 68.9 | 1.0 | 0.9 | 1.9 | 0.8 | 0.6 | 0.1 | 1.0 | 1.0 |
| Matt Geiger | 48 | 11.5 | 4.5 | 1.6 | 3.0 | 52.4 | 0.0 | 0.1 | 0.0 | 1.3 | 1.9 | 67.4 | 1.0 | 1.5 | 2.5 | 0.3 | 0.3 | 0.4 | 0.8 | 1.0 |
| ... | ... | ... | ... | ... | ... | ... | ... | ... | ... | ... | ... | ... | ... | ... | ... | ... | ... | ... | ... | ... |
| Chris Smith | 80 | 15.8 | 4.3 | 1.6 | 3.6 | 43.3 | 0.0 | 0.2 | 14.3 | 1.2 | 1.5 | 79.2 | 0.4 | 0.8 | 1.2 | 2.5 | 0.6 | 0.2 | 0.8 | 0.0 |
| Brent Price | 68 | 12.6 | 3.9 | 1.5 | 4.1 | 35.8 | 0.1 | 0.7 | 16.7 | 0.8 | 1.0 | 79.4 | 0.4 | 1.1 | 1.5 | 2.3 | 0.8 | 0.0 | 1.3 | 1.0 |
| Marlon Maxey | 43 | 12.1 | 5.4 | 2.2 | 3.9 | 55.0 | 0.0 | 0.0 | 0.0 | 1.0 | 1.6 | 64.3 | 1.5 | 2.3 | 3.8 | 0.3 | 0.3 | 0.4 | 0.9 | 0.0 |
| Litterial Green | 52 | 12.0 | 4.5 | 1.7 | 3.8 | 43.9 | 0.0 | 0.2 | 10.0 | 1.2 | 1.8 | 62.5 | 0.2 | 0.4 | 0.7 | 2.2 | 0.4 | 0.1 | 0.8 | 1.0 |
| Jon Barry | 47 | 11.7 | 4.4 | 1.6 | 4.4 | 36.9 | 0.4 | 1.3 | 33.3 | 0.7 | 1.0 | 67.3 | 0.2 | 0.7 | 0.9 | 1.4 | 0.7 | 0.1 | 0.9 | 1.0 |
1340 rows × 20 columns
colors = sns.xkcd_palette(['dark blue','light red'])
sns.palplot(colors)
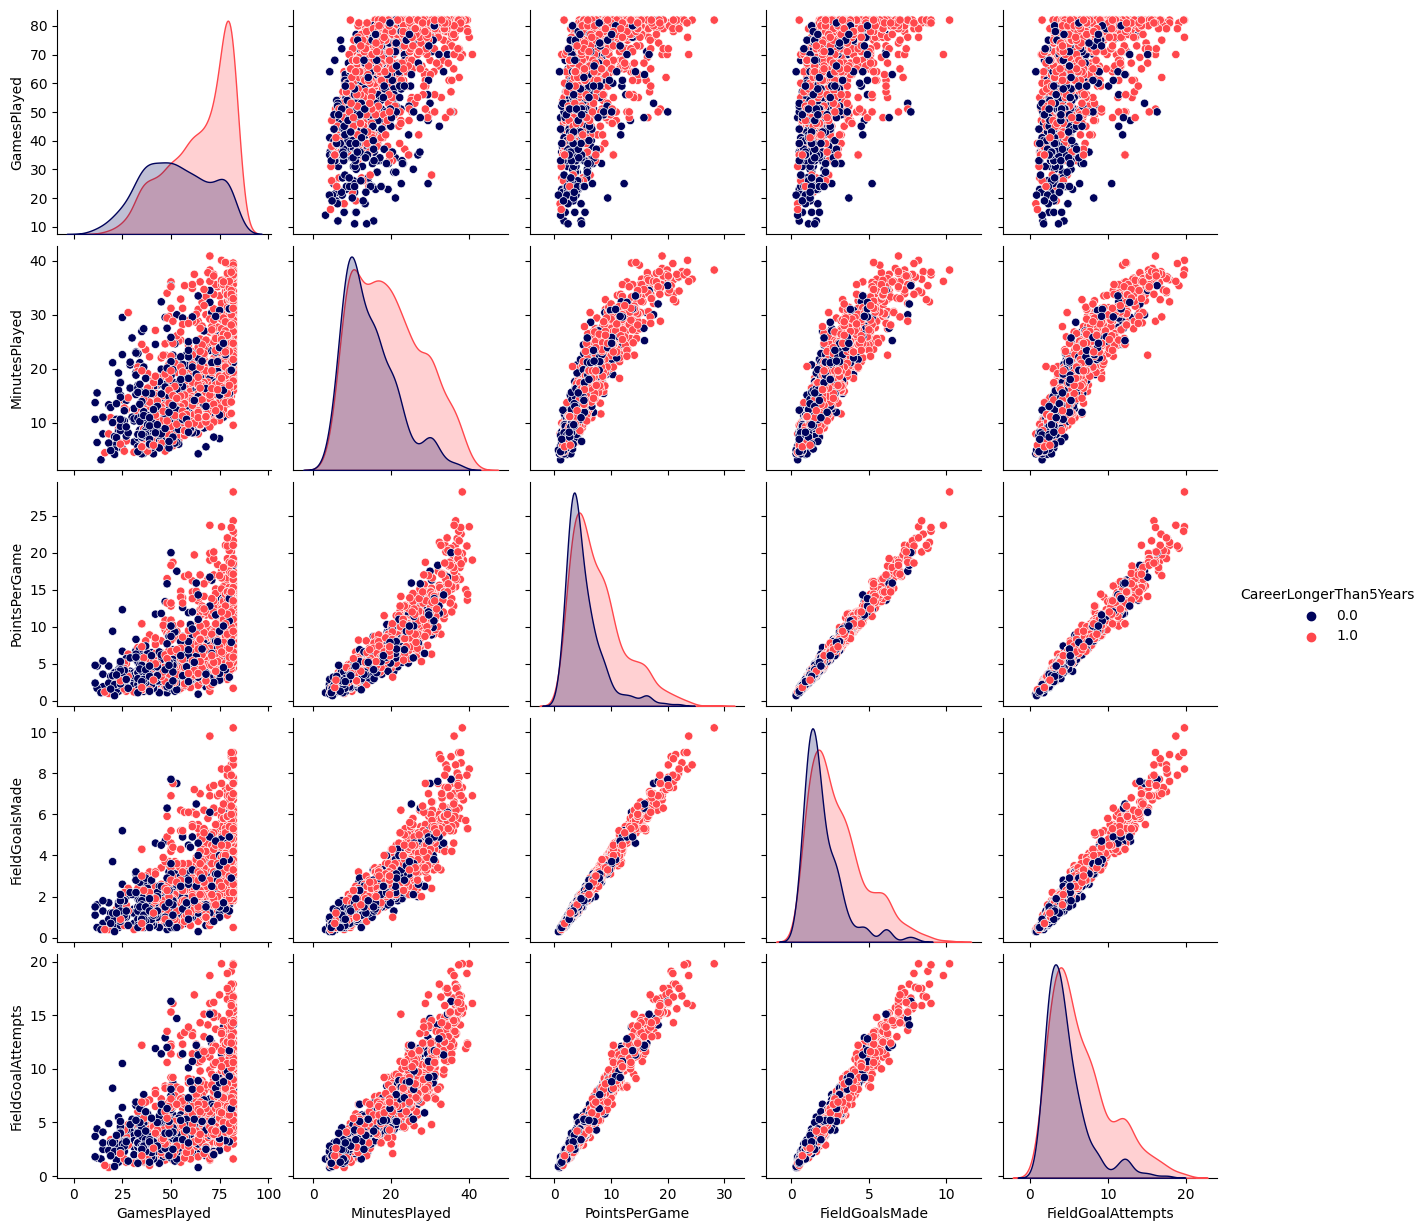
sns.pairplot(data=nba_data.iloc[:,:5].join(nba_data.iloc[:,-1:]), hue='CareerLongerThan5Years',palette=colors)
<seaborn.axisgrid.PairGrid at 0x7ff8a3231ee0>
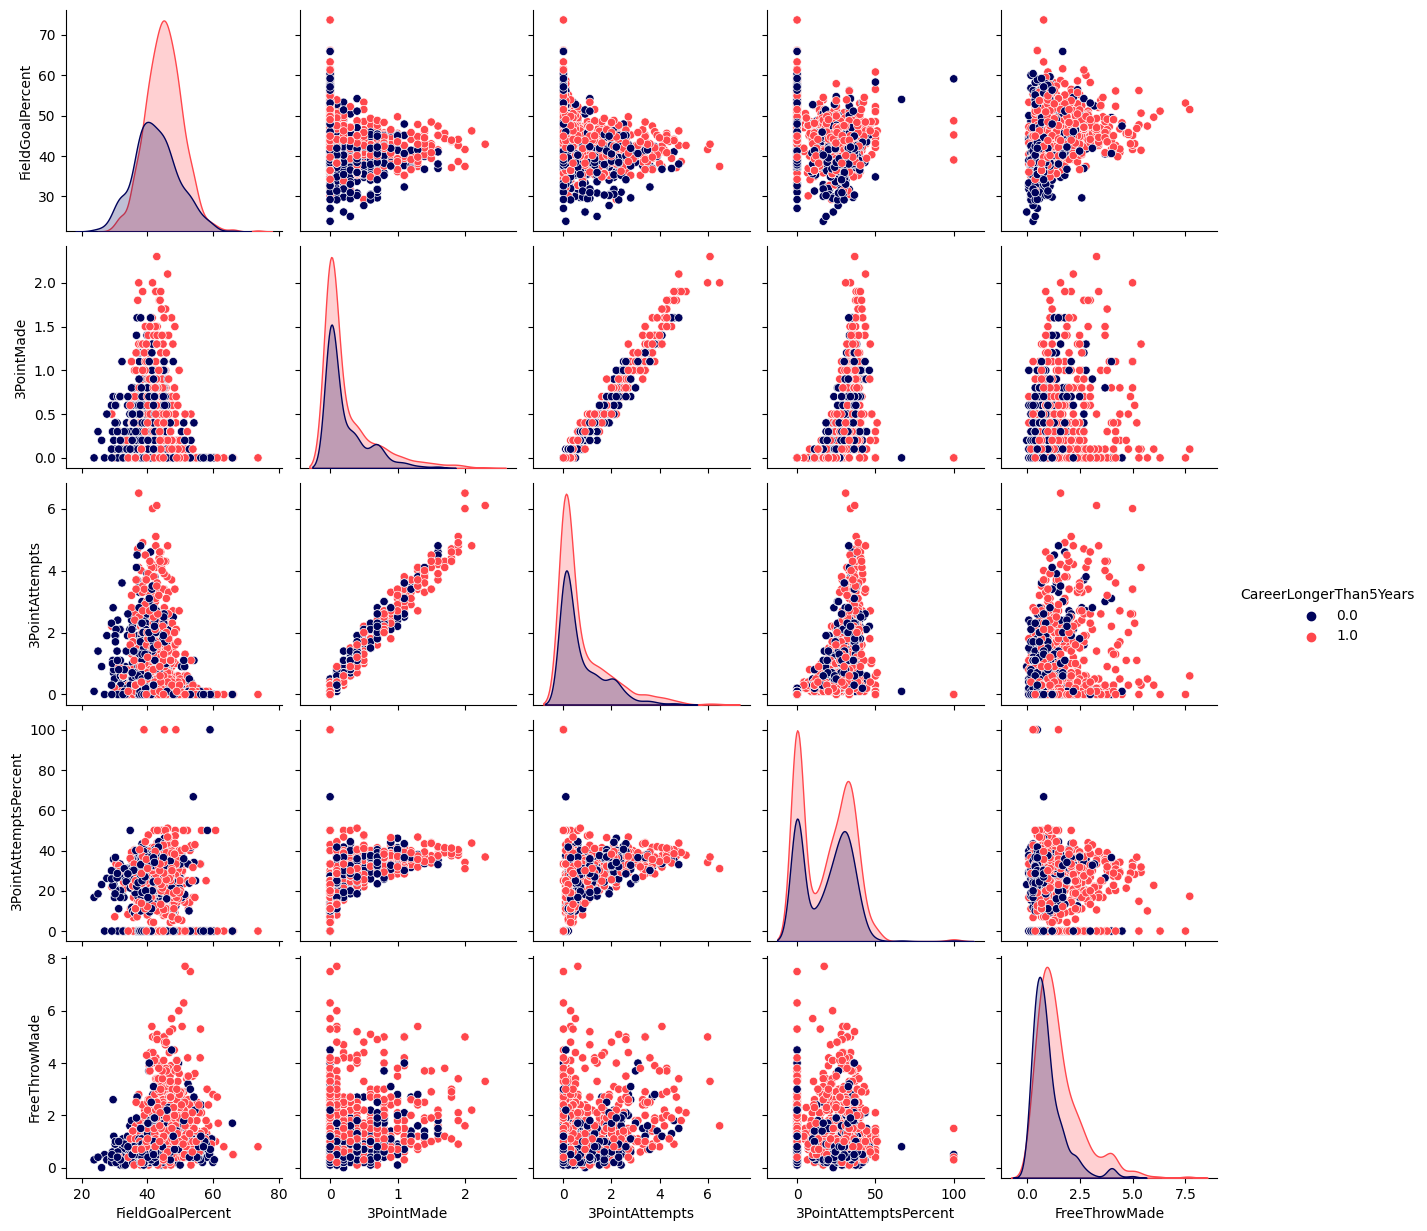
sns.pairplot(data=nba_data.iloc[:,5:10].join(nba_data.iloc[:,-1:]), hue='CareerLongerThan5Years',palette=colors)
<seaborn.axisgrid.PairGrid at 0x7ff86728a610>
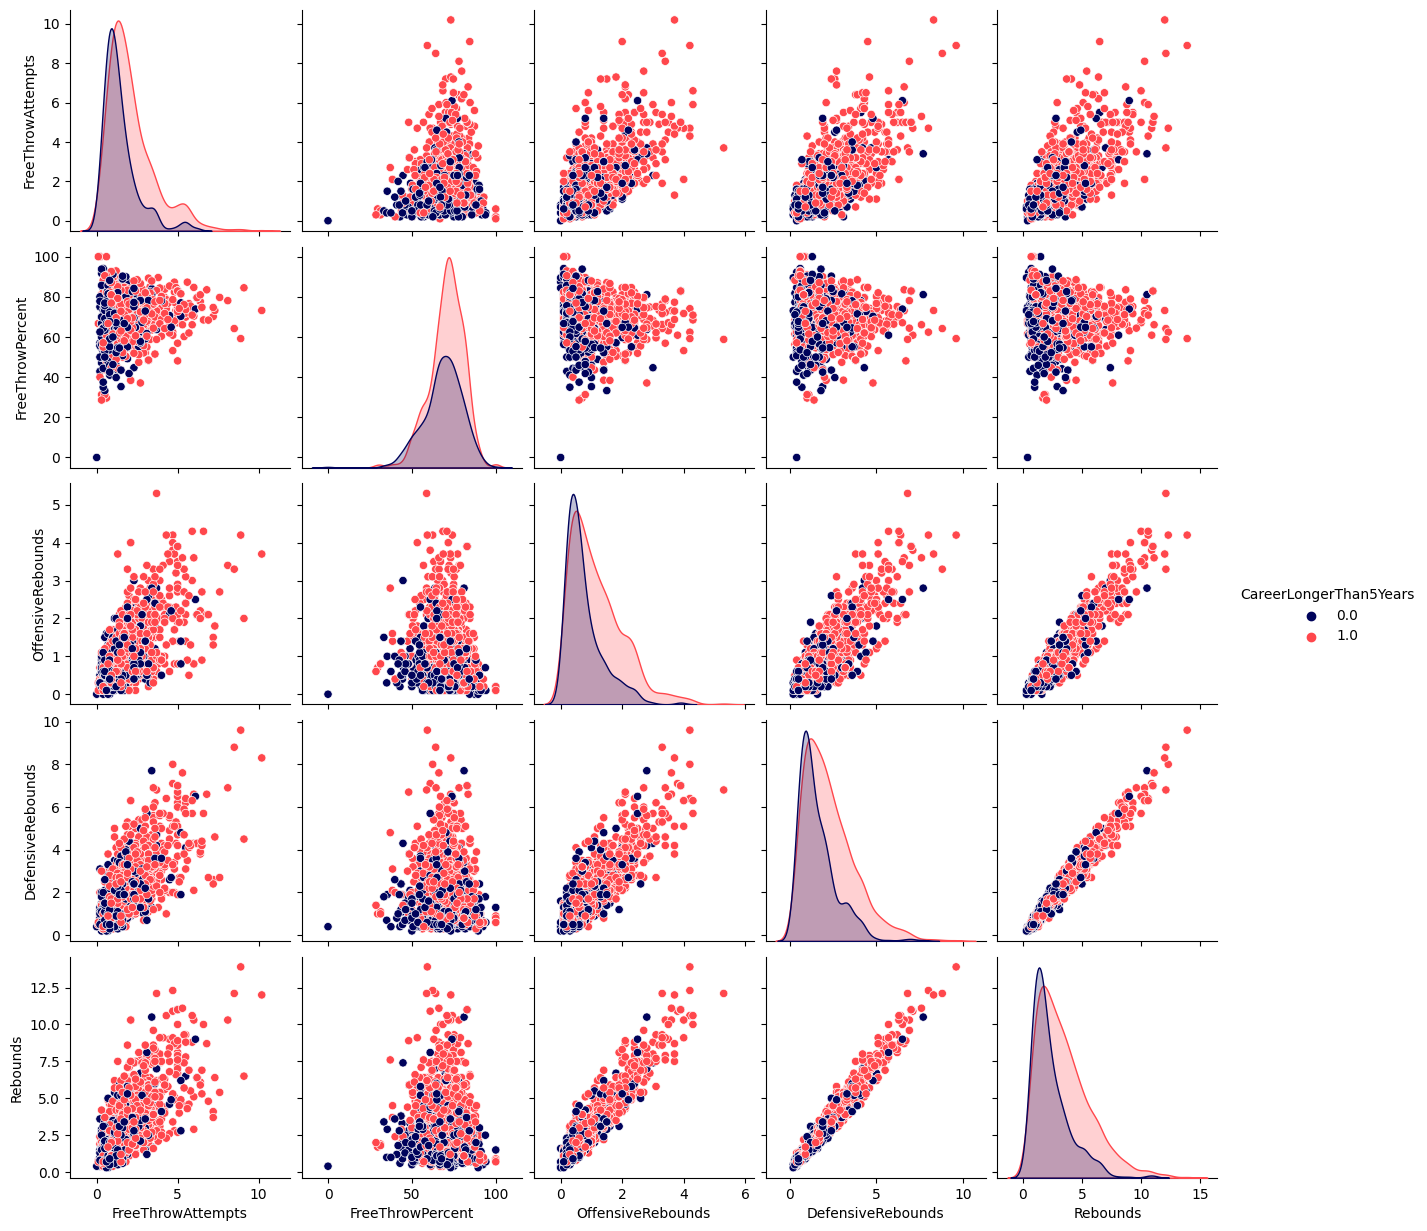
sns.pairplot(data=nba_data.iloc[:,10:15].join(nba_data.iloc[:,-1:]), hue='CareerLongerThan5Years',palette=colors)
<seaborn.axisgrid.PairGrid at 0x7ff864f25310>
sns.pairplot(data=nba_data.iloc[:,15:], hue='CareerLongerThan5Years',palette=colors)
<seaborn.axisgrid.PairGrid at 0x7ff85d376df0>
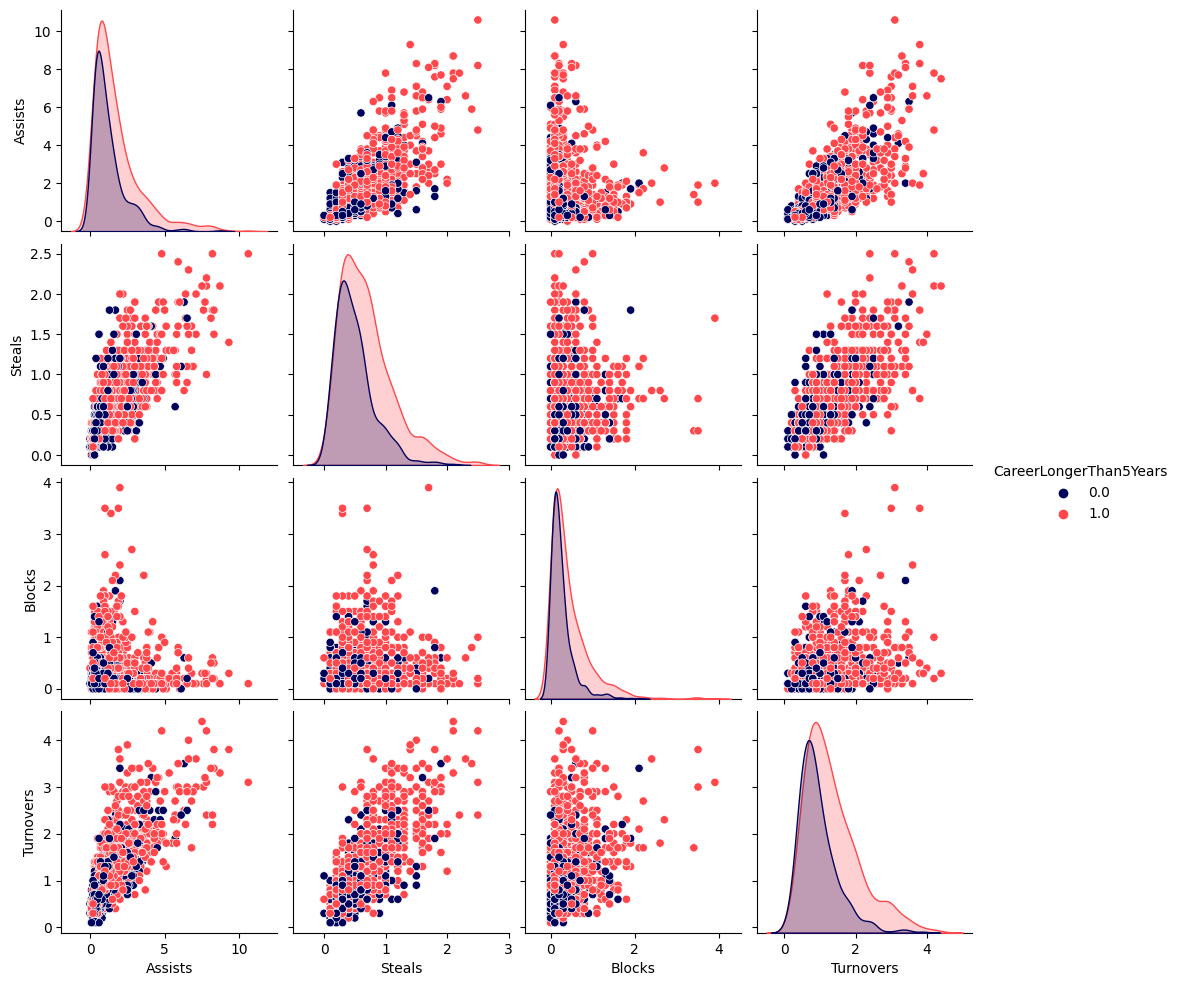
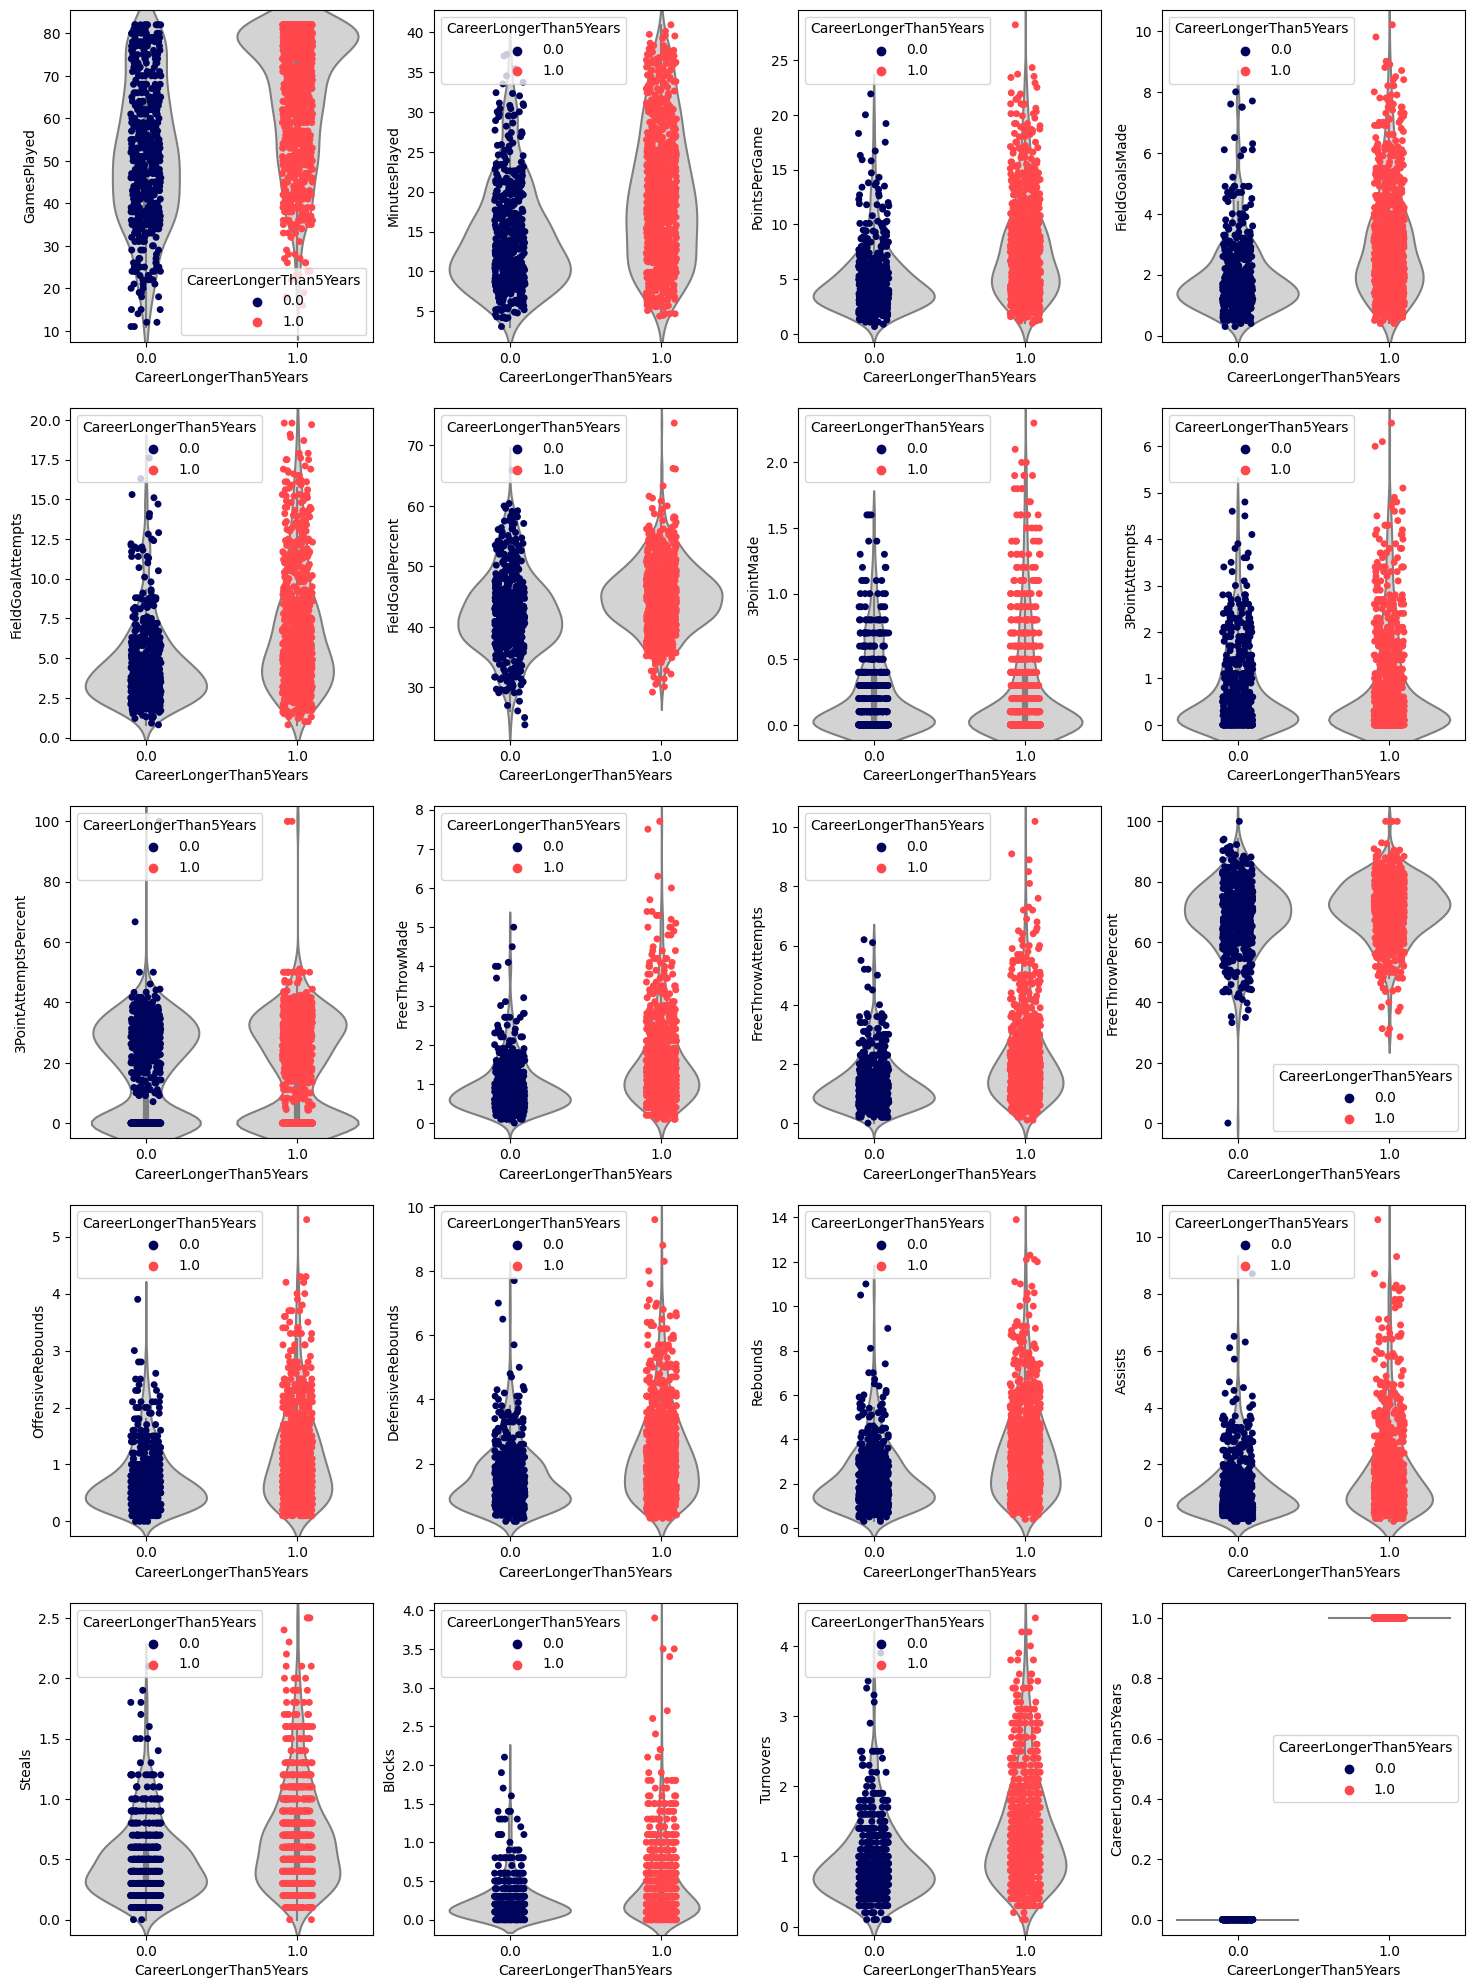
The column “Gamesplayed” is one of the most decisive columns because it provides the clearest data which does not overlap a lot between players that have a career longer than five years and those who have not played for 5 years.
#sns.violinplot(data=nba_data, x='CareerLongerThan5Years', y='GamesPlayed' ,color='lightgrey')
#sns.stripplot(data=nba_data, x='CareerLongerThan5Years', y='GamesPlayed',palette=colors)


fig, axes = plt.subplots(int(len(nba_data.axes[1])/4), 4, figsize=(18,25))
for i in range(int(len(nba_data.columns)/4)):
    for j in range(4):
        sns.violinplot(ax=axes[i, j], data=nba_data, x='CareerLongerThan5Years', y=nba_data.columns[i*4+j],color='lightgrey')
        sns.stripplot(ax=axes[i, j], data=nba_data, x='CareerLongerThan5Years', y=nba_data.columns[i*4+j],palette=colors,hue='CareerLongerThan5Years')
        plt.figure()
/tmp/ipykernel_1839/2495864547.py:10: RuntimeWarning: More than 20 figures have been opened. Figures created through the pyplot interface (`matplotlib.pyplot.figure`) are retained until explicitly closed and may consume too much memory. (To control this warning, see the rcParam `figure.max_open_warning`). Consider using `matplotlib.pyplot.close()`.
  plt.figure()
<Figure size 640x480 with 0 Axes>
<Figure size 640x480 with 0 Axes>
<Figure size 640x480 with 0 Axes>
<Figure size 640x480 with 0 Axes>
<Figure size 640x480 with 0 Axes>
<Figure size 640x480 with 0 Axes>
<Figure size 640x480 with 0 Axes>
<Figure size 640x480 with 0 Axes>
<Figure size 640x480 with 0 Axes>
<Figure size 640x480 with 0 Axes>
<Figure size 640x480 with 0 Axes>
<Figure size 640x480 with 0 Axes>
<Figure size 640x480 with 0 Axes>
<Figure size 640x480 with 0 Axes>
<Figure size 640x480 with 0 Axes>
<Figure size 640x480 with 0 Axes>
<Figure size 640x480 with 0 Axes>
<Figure size 640x480 with 0 Axes>
<Figure size 640x480 with 0 Axes>
<Figure size 640x480 with 0 Axes>
fig, axes = plt.subplots(int(len(nba_data.axes[1])/4), 4, figsize=(18,25))
sns.boxplot(ax=axes[0, 0], data=nba_data, x='CareerLongerThan5Years', y='GamesPlayed',palette=colors)
plt.figure()
#sns.FacetGrid(data=nba_data, hue="CareerLongerThan5Years", col="GamesPlayed", height=4, palette=colors).map(sns.kdeplot, "GamesPlayed", shade=True, cut=0).add_legend()
for i in range(int(len(nba_data.columns)/4)):
    for j in range(4):
        sns.boxplot(ax=axes[i, j], data=nba_data, x='CareerLongerThan5Years', y=nba_data.columns[i*4+j],palette=colors)
        plt.figure()
/tmp/ipykernel_1839/1619567479.py:8: RuntimeWarning: More than 20 figures have been opened. Figures created through the pyplot interface (`matplotlib.pyplot.figure`) are retained until explicitly closed and may consume too much memory. (To control this warning, see the rcParam `figure.max_open_warning`). Consider using `matplotlib.pyplot.close()`.
  plt.figure()
<Figure size 640x480 with 0 Axes>
<Figure size 640x480 with 0 Axes>
<Figure size 640x480 with 0 Axes>
<Figure size 640x480 with 0 Axes>
<Figure size 640x480 with 0 Axes>
<Figure size 640x480 with 0 Axes>
<Figure size 640x480 with 0 Axes>
<Figure size 640x480 with 0 Axes>
<Figure size 640x480 with 0 Axes>
<Figure size 640x480 with 0 Axes>
<Figure size 640x480 with 0 Axes>
<Figure size 640x480 with 0 Axes>
<Figure size 640x480 with 0 Axes>
<Figure size 640x480 with 0 Axes>
<Figure size 640x480 with 0 Axes>
<Figure size 640x480 with 0 Axes>
<Figure size 640x480 with 0 Axes>
<Figure size 640x480 with 0 Axes>
<Figure size 640x480 with 0 Axes>
<Figure size 640x480 with 0 Axes>
<Figure size 640x480 with 0 Axes>
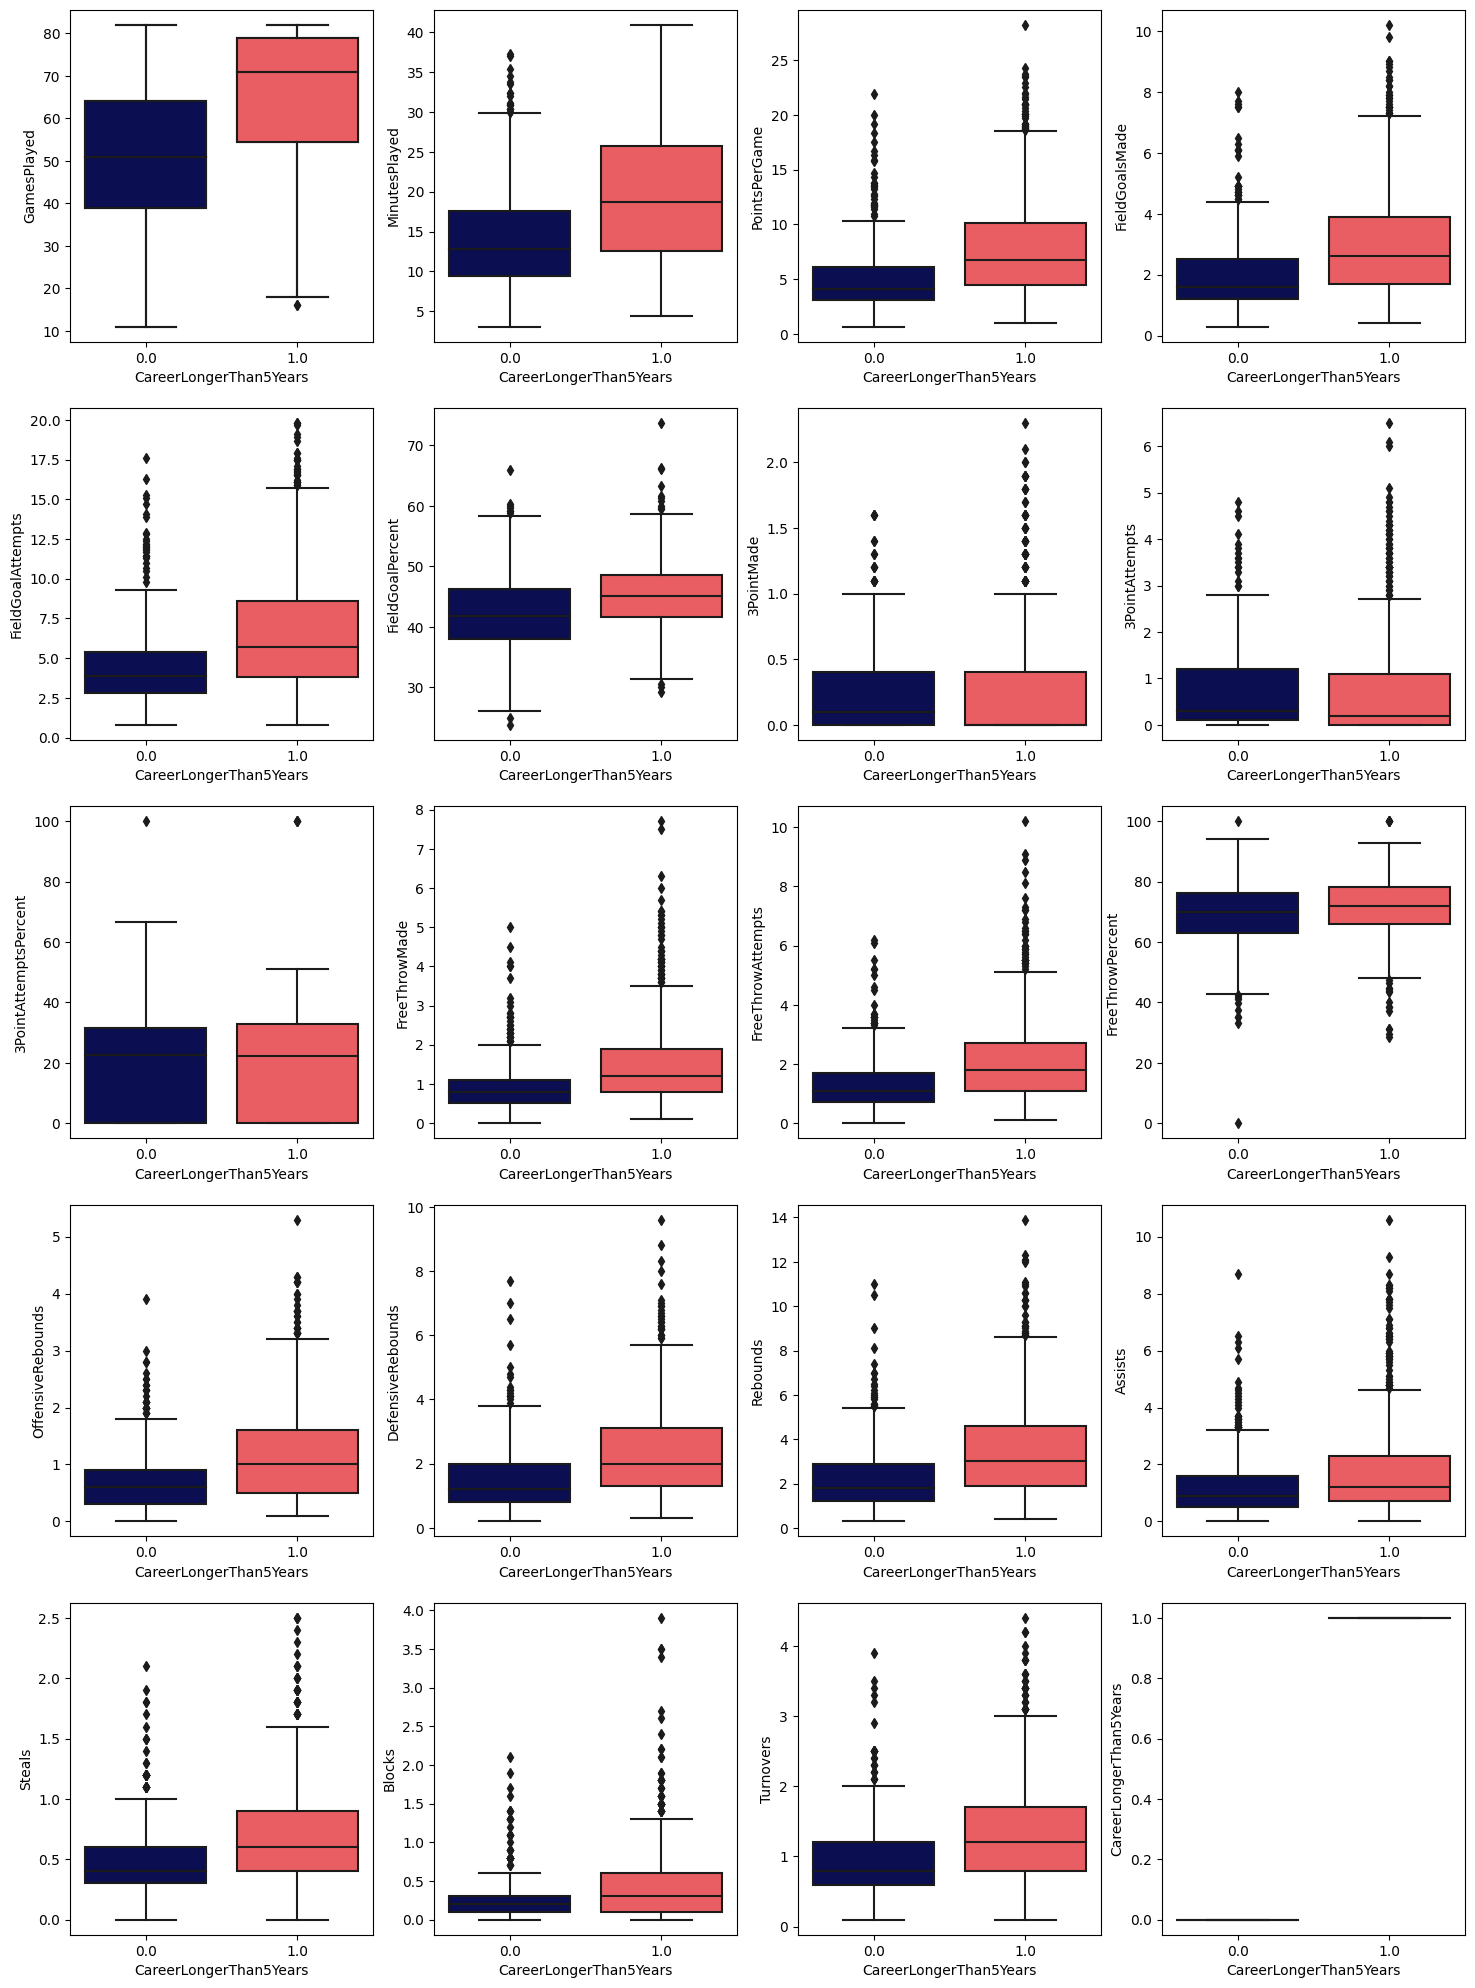
We can see that those players who play more games have a higher chance of having a career longer than 5 years. But it overlaps a lot, so we can’t say that it is a good predictor.It requires other fields to get a better overview.
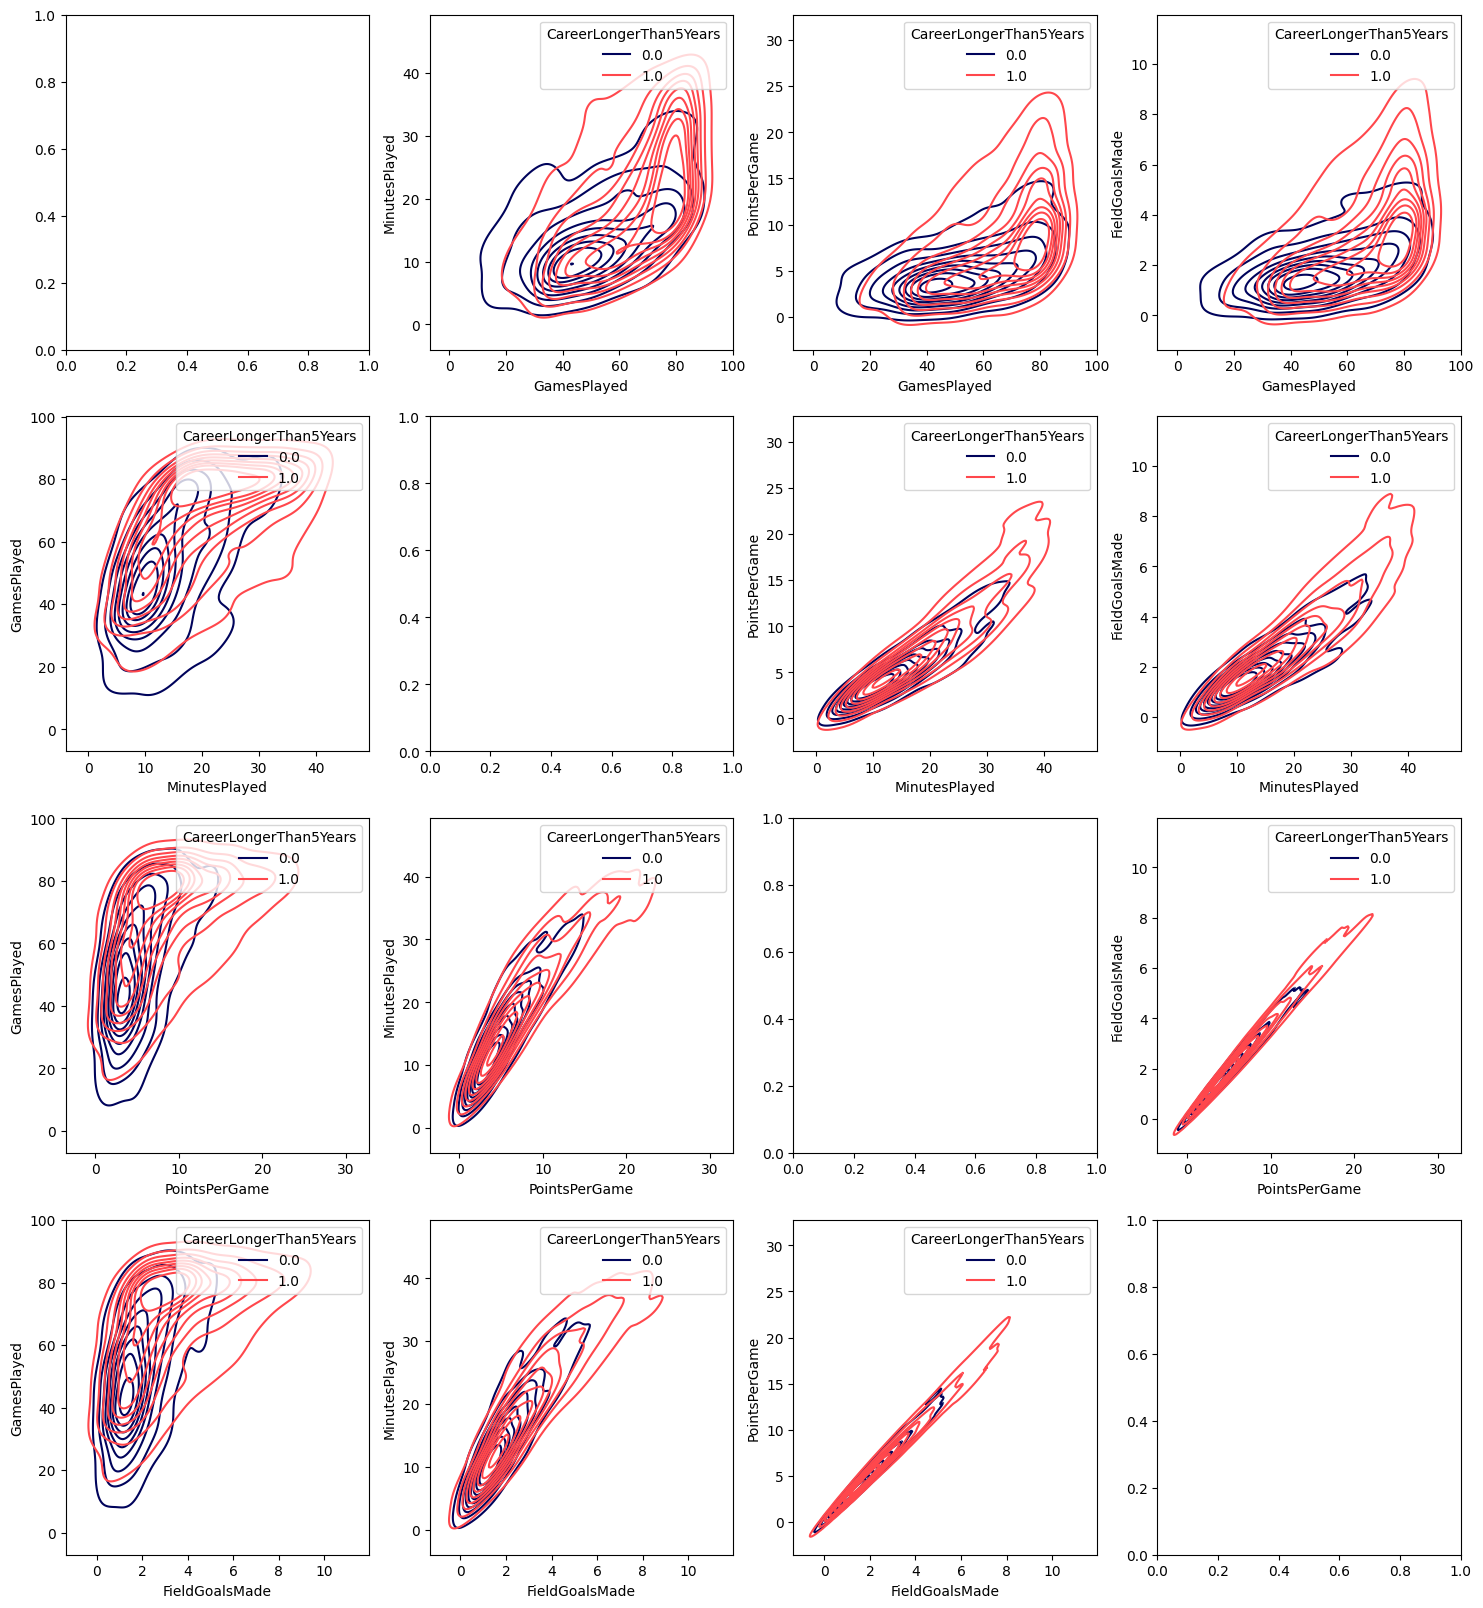
gamesPlayed_values = ['GamesPlayed','MinutesPlayed','PointsPerGame','FieldGoalsMade']

fig, axes = plt.subplots(4, 4, figsize=(18,20))
plt.figure()
for i in range(int(len(gamesPlayed_values))):
    for j in range(int(len(gamesPlayed_values))):
        if i != j:
            sns.kdeplot(ax=axes[i, j], data=nba_data, hue='CareerLongerThan5Years', x=gamesPlayed_values[i],y=gamesPlayed_values[j],palette=colors)
            plt.figure()
<Figure size 640x480 with 0 Axes>
<Figure size 640x480 with 0 Axes>
<Figure size 640x480 with 0 Axes>
<Figure size 640x480 with 0 Axes>
<Figure size 640x480 with 0 Axes>
<Figure size 640x480 with 0 Axes>
<Figure size 640x480 with 0 Axes>
<Figure size 640x480 with 0 Axes>
<Figure size 640x480 with 0 Axes>
<Figure size 640x480 with 0 Axes>
<Figure size 640x480 with 0 Axes>
<Figure size 640x480 with 0 Axes>
<Figure size 640x480 with 0 Axes>
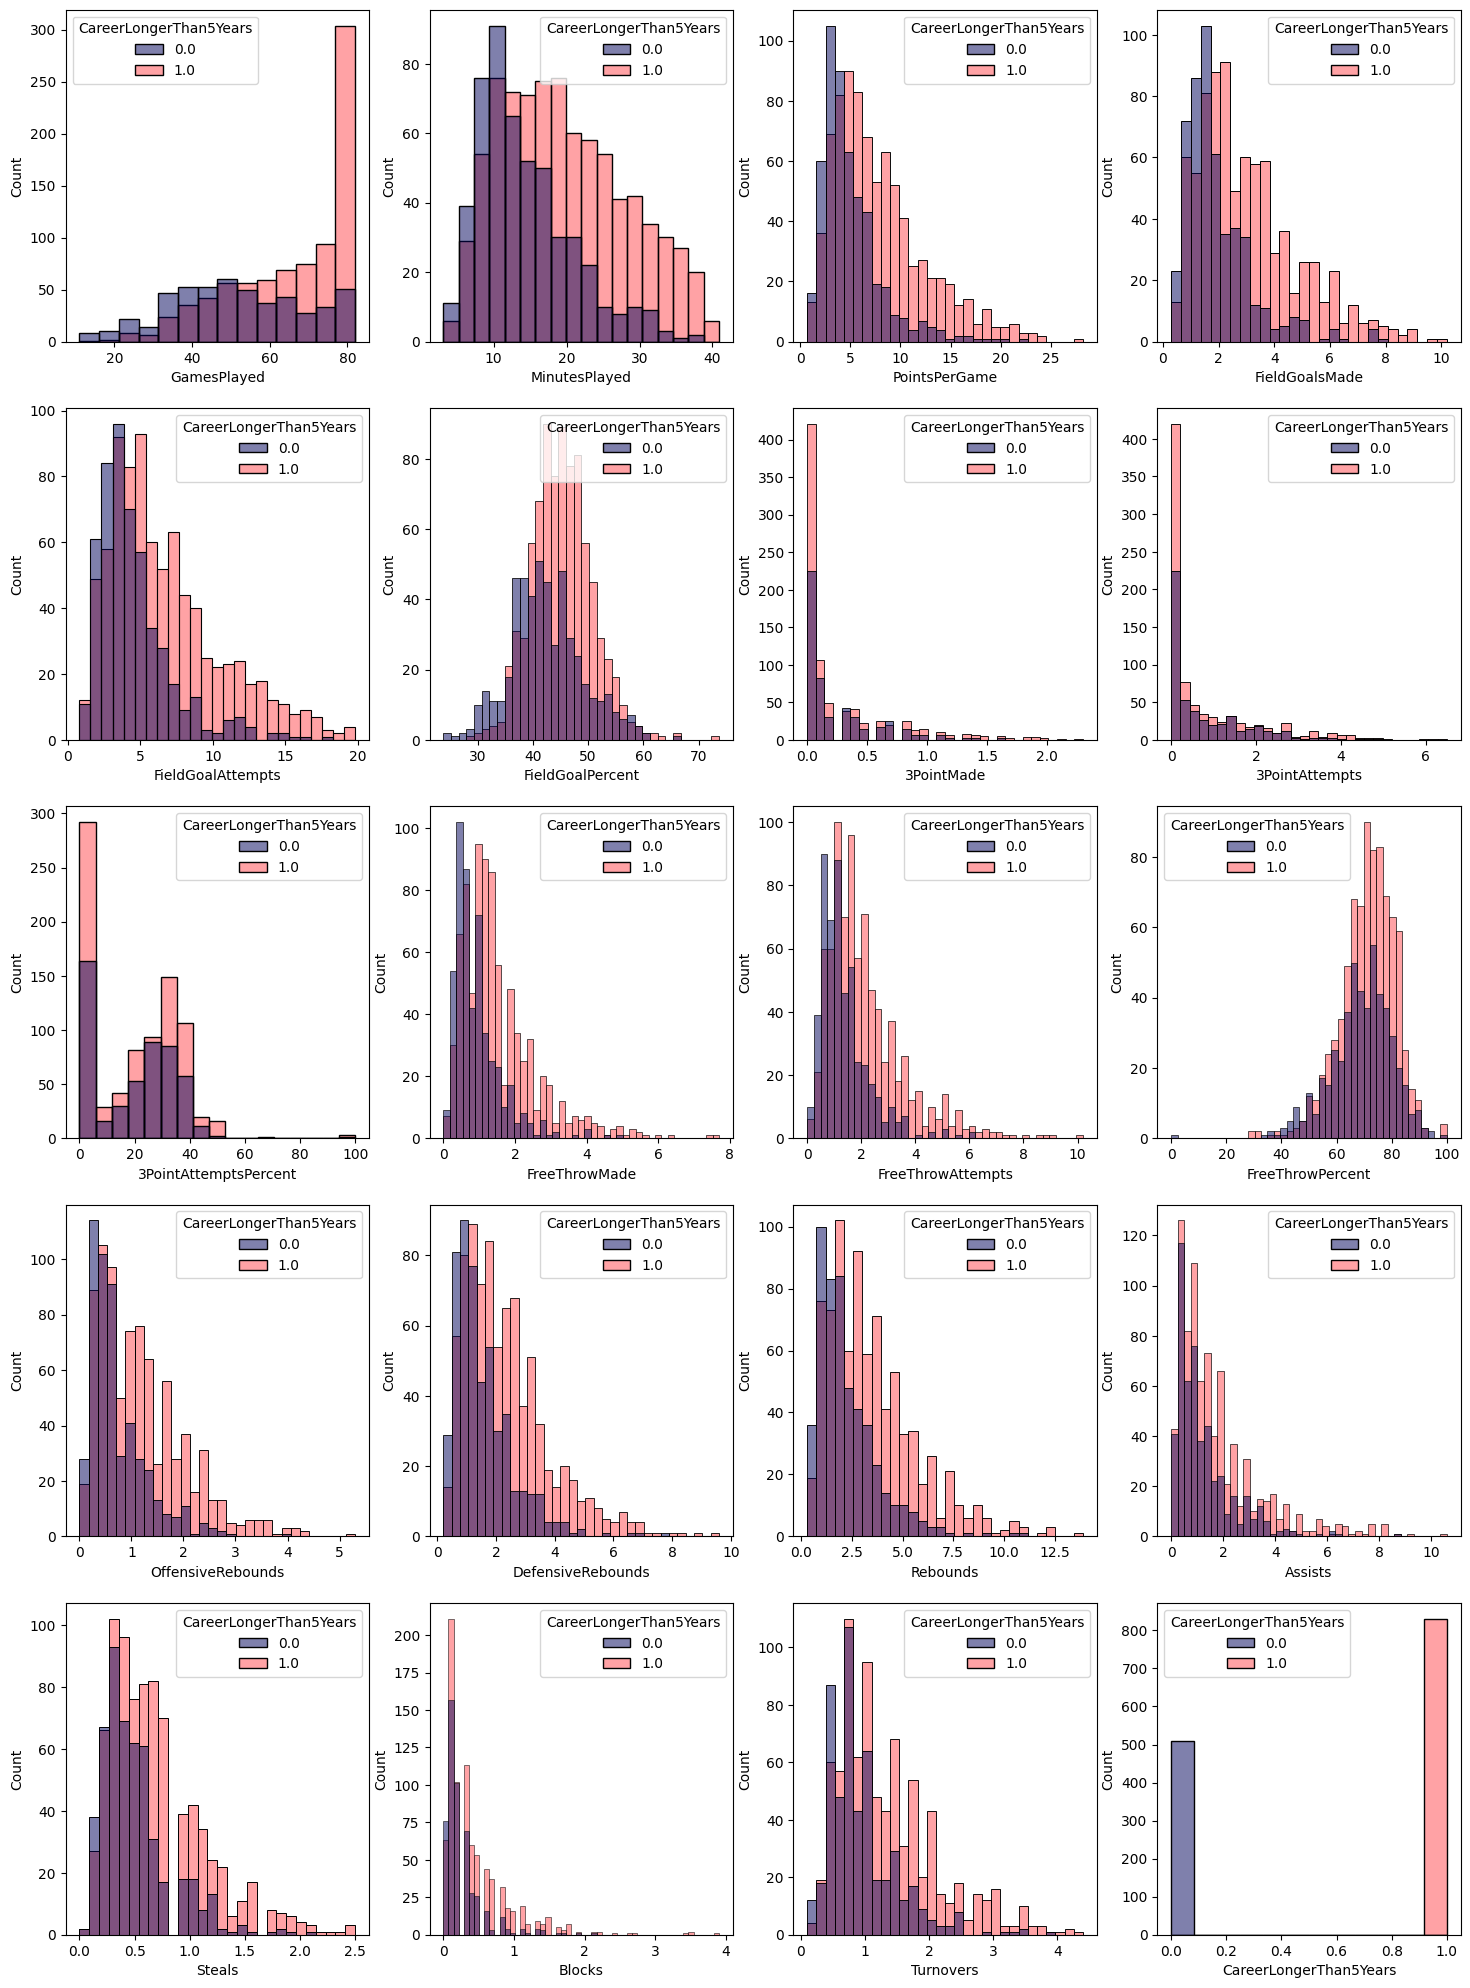
fig, axes = plt.subplots(int(len(nba_data.axes[1])/4), 4, figsize=(18,25))
plt.figure()
for i in range(int(len(nba_data.columns)/4)):
    for j in range(4):
        sns.histplot(ax=axes[i, j], data=nba_data, hue='CareerLongerThan5Years', x=nba_data.columns[i*4+j],palette=colors)
        plt.figure()
/tmp/ipykernel_1839/1784320525.py:6: RuntimeWarning: More than 20 figures have been opened. Figures created through the pyplot interface (`matplotlib.pyplot.figure`) are retained until explicitly closed and may consume too much memory. (To control this warning, see the rcParam `figure.max_open_warning`). Consider using `matplotlib.pyplot.close()`.
  plt.figure()
<Figure size 640x480 with 0 Axes>
<Figure size 640x480 with 0 Axes>
<Figure size 640x480 with 0 Axes>
<Figure size 640x480 with 0 Axes>
<Figure size 640x480 with 0 Axes>
<Figure size 640x480 with 0 Axes>
<Figure size 640x480 with 0 Axes>
<Figure size 640x480 with 0 Axes>
<Figure size 640x480 with 0 Axes>
<Figure size 640x480 with 0 Axes>
<Figure size 640x480 with 0 Axes>
<Figure size 640x480 with 0 Axes>
<Figure size 640x480 with 0 Axes>
<Figure size 640x480 with 0 Axes>
<Figure size 640x480 with 0 Axes>
<Figure size 640x480 with 0 Axes>
<Figure size 640x480 with 0 Axes>
<Figure size 640x480 with 0 Axes>
<Figure size 640x480 with 0 Axes>
<Figure size 640x480 with 0 Axes>
<Figure size 640x480 with 0 Axes>